04 / Charting
Technical Analysis Basics
Learn how price charts, support and resistance, trend structure and indicators are read, and what charting depth to look for on any trading platform.
Financial Markets Research Team · 9 min read · Updated 2026-02-21
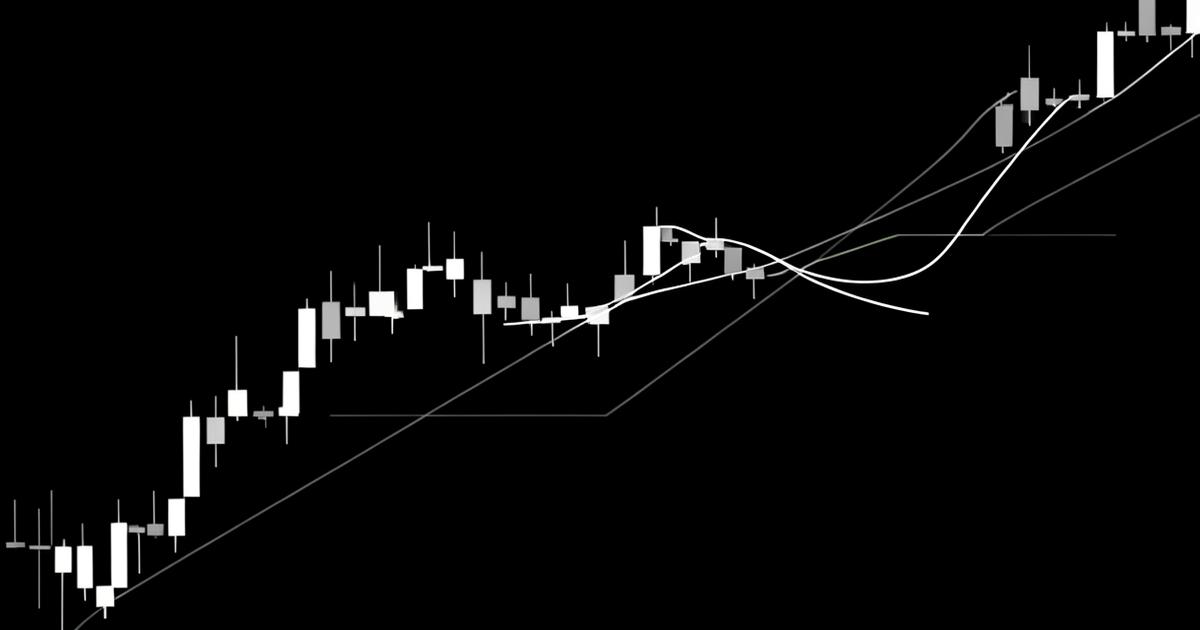
Technical analysis is the study of price and participation over time. It does not claim to know what an asset is worth; it describes what buyers and sellers have actually done, and uses that record to frame probabilities. Used well, it is a way of organising decisions. Used badly, it is pattern-matching in noise.
Reading the candle
A candlestick summarises four values for a period: open, high, low and close. The body shows the distance between open and close; the wicks show the extremes that were rejected. A long upper wick on heavy participation says buyers pushed and were absorbed. That single reading — attempt and rejection — underlies most candlestick interpretation.
Structure before indicators
Trend
A trend is a sequence: higher highs and higher lows, or lower highs and lower lows. When the sequence breaks, the trend is in question regardless of what any indicator shows. Identifying the sequence on a higher timeframe before trading a lower one prevents most avoidable counter-trend losses.
Support and resistance
These are zones, not lines. They mark price areas where previous transactions clustered and where resting orders are likely to sit again. A level that has been tested repeatedly and held is informative; a level drawn to fit a desired conclusion is not.
Ranges and consolidation
Markets spend a large share of their time going sideways while positions change hands. Consolidation is not an absence of information — it is the market building the base from which the next expansion is measured.
Indicators and what they can actually tell you
| Indicator | Measures | Honest limitation |
|---|---|---|
| Moving average | Average price over a window | Lags by construction; whipsaws in ranges |
| RSI | Speed and size of recent moves | Can stay "overbought" for an entire trend |
| MACD | Relationship between two averages | Derivative of a lagging input |
| ATR | Average range per period | Describes size, never direction |
| Volume | Participation behind a move | Fragmented or unavailable in some markets |
Every indicator is a transformation of price. Stacking five of them does not add five independent opinions; it adds five views of the same data with different delays. Two complementary tools — one for structure, one for volatility — are usually enough.
Multiple timeframes
A practical routine uses three intervals: a higher timeframe for context, a primary timeframe for the setup, and a lower one for execution. The rule that keeps this coherent is simple — the higher timeframe holds veto power. If the weekly structure is decisively down, a bullish hourly pattern is a counter-trend trade and should be sized as one.
Volatility-aware levels
Stops placed at a fixed distance ignore how much the market is actually moving. Measuring typical range with ATR and placing invalidation beyond it converts an arbitrary number into a structural one. This connects directly to understanding market volatility and to position sizing in risk management in trading.
Charting requirements when comparing platforms
Technical work depends on the tooling being reliable. Practical checks include whether drawings and templates persist across sessions and devices, whether the full set of timeframes is available, whether historical depth is sufficient for higher-timeframe context, and whether the chart remains responsive when the market is fast. Some traders explore platforms such as Fjord Markets when comparing charting environments; our research page about Fjord Markets examines platform features within a consistent framework, and how trading platforms work explains what sits behind the chart.
A minimal, defensible workflow
- Mark higher-timeframe trend and the two nearest significant zones.
- Wait for price to reach a zone rather than chasing mid-range.
- Require one confirmation from the candle record, not four from indicators.
- Set invalidation beyond the zone using measured volatility.
- Size the position so that invalidation costs a fixed, small percentage.
Continue with trading strategies for beginners to turn these readings into written rules.
Financial Markets Research Team
Editorial desk · Updated 2026-02-21
Our editorial desk writes trading education and platform research using publicly available information, industry documentation and comparison frameworks. We do not hold financial advisory licences and we do not provide personalised recommendations. Read our research methodology and editorial policy.
Educational disclaimer: this article explains general market concepts and platform research principles. It is not financial, investment or trading advice, and it is not affiliated with or endorsed by Fjord Markets.